[1]:
import earthkit.hydro as ekh
import numpy as np
import matplotlib.pyplot as plt

network = ekh.river_network.load("efas", "5", use_cache=False)
Cache disabled.
Catchment delineation
Locating a catchment of a gauge location in earthkit-hydro is done using the catchments.find method.
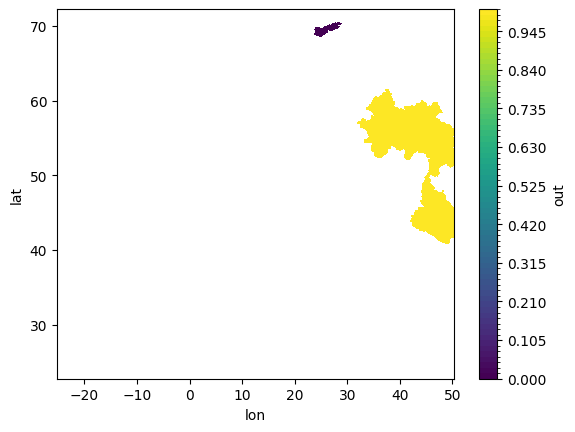
Specifying locations
Specifying locations in earthkit-hydro can be done in 3 main ways. The simplest is to specify directly the coordinates as a dictionary. The EFAS network coordinates are latitude and longitude, so we can specify as below:
[2]:
da = ekh.catchments.find(network, locations={
    "gauge_1": (70.475, 28.32),
    "gauge_2": (42.225, 50.24)
})

da.plot.contourf(cmap="viridis", levels=100)
plt.show()

[3]:
test = np.ones(network.shape, dtype=bool)
test[(106,  3214)] = 0
test.flat[network.mask].argmin()
[3]:
np.int64(26066)
It is also possible to specify directly the grid indices.
[4]:
da = ekh.catchments.find(network, locations=[
    (106,  3214),
    (1801, 4529)
])

da.plot.contourf(cmap="viridis", levels=100)
plt.show()

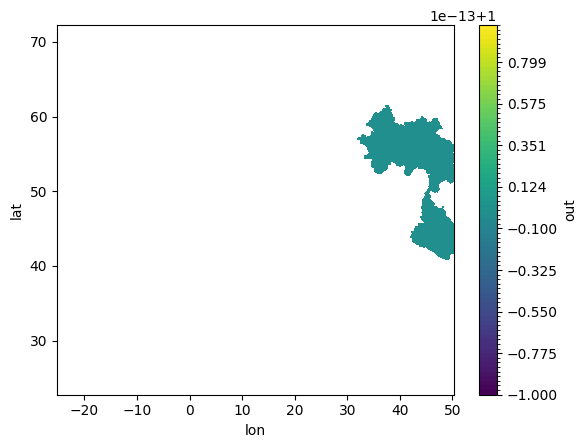
Or for very advanced cases, one can also specify directly the node ids.
[5]:
da = ekh.catchments.find(network, locations=[26066, 4153831])

da.plot.contourf(cmap="viridis", levels=100)
plt.show()
Subcatchments
Subcatchments can also be found by passing in the overwrite=False argument. This defines a new subcatchment at each gauge location.
[6]:
da = ekh.catchments.find(network, locations={
    "gauge_1": (47.04166666666667, 47.40833333333333),
    "gauge_2": (42.225, 50.24)
}, overwrite=False)

da.plot.contourf(cmap="viridis", levels=100)
plt.show()
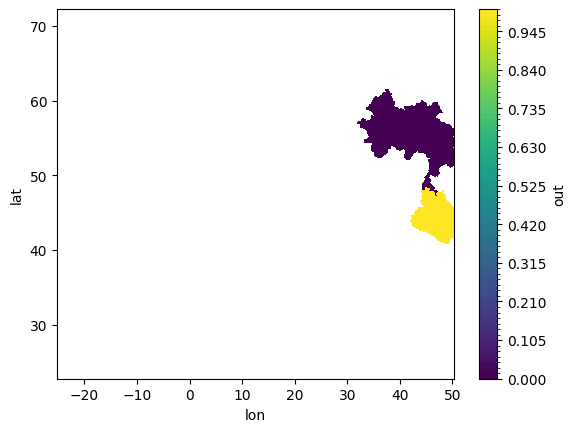
…unlike the default overwrite=True which has the largest catchment overwrite all subcatchments.
[7]:
da = ekh.catchments.find(network, locations={
    "gauge_1": (47.04166666666667, 47.40833333333333),
    "gauge_2": (42.225, 50.24)
})

da.plot.contourf(cmap="viridis", levels=100)
plt.show()