The earthkit ecosystem
Understanding how earthkit-hydro fits into the broader earthkit family helps you leverage the full power of the ecosystem.
What is earthkit?
earthkit [ECM22b] is a collection of Python tools for working with earth system data. Each component focuses on a specific domain:
earthkit-hydro: Hydrological analysis (this package)
earthkit-data: Data acquisition and access
earthkit-plots: Visualization and mapping
earthkit-transforms: Data transformations
earthkit-geo: Regridding and geographic computations
earthkit-meteo: Meteorological calculations
Why the modular design?
Rather than one monolithic package, earthkit components are:
Focused: Each does one thing well
Independent: Use only what you need
Compatible: Designed to work together seamlessly
Maintainable: Smaller codebases, clearer purpose
Interoperability
The earthkit components are built to integrate seamlessly between each other via support for xarray, arrays and fieldlists.
Example workflow
Here’s how different earthkit packages work together in a typical hydrological analysis:
import earthkit.data as ekd
import earthkit.hydro as ekh
import earthkit.plots as ekp
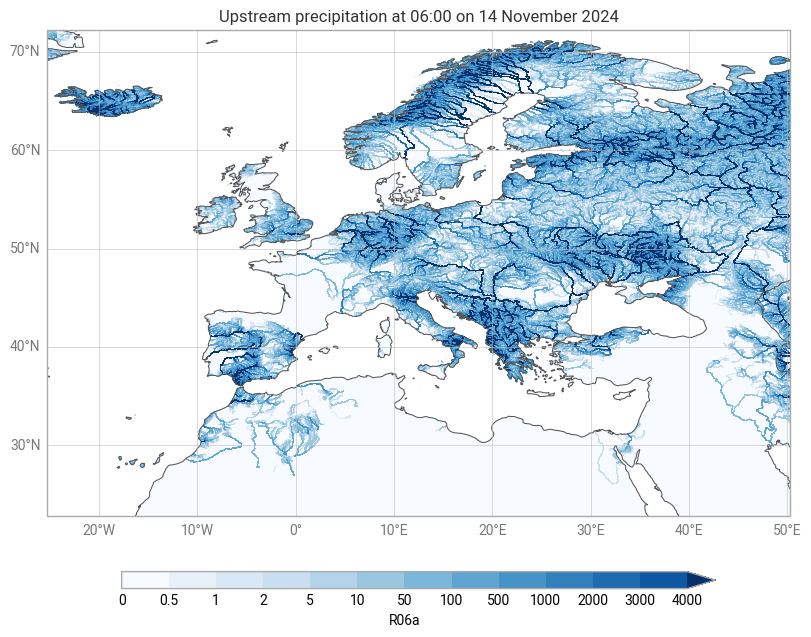
# specify some custom styles
style = ekp.styles.Style(
colors="Blues",
levels=[0, 0.5, 1, 2, 5, 10, 50, 100, 500, 1000, 2000, 3000, 4000],
extend="max",
)
# load data and river network
network = ekh.river_network.load("efas", "5")
da = ekd.from_source(
"sample",
"R06a.nc",
).to_xarray()["R06a"].isel(time=0).load()
# compute upstream accumulation
upstream_sum = ekh.upstream.sum(network, da)
# plot result
chart = ekp.Map()
chart.quickplot(upstream_sum, style=style)
chart.legend(label="{variable_name}")
chart.title("Upstream precipitation at {time:%H:%M on %-d %B %Y}")
chart.coastlines()
chart.gridlines()
chart.show()
In this example:
earthkit-data fetches the precipitation data
earthkit-hydro performs upstream accumulation
earthkit-plots visualizes the result
The xarray DataArray flows through each step, preserving coordinates and metadata.
Benefits for your workflow
Using earthkit components together provides:
Consistency: Similar API design across components
Efficiency: No data format conversions between steps
Completeness: From data access to visualization in one ecosystem
Community: Shared user base and development practices
When to use earthkit-hydro standalone
You don’t need the full earthkit ecosystem to use earthkit-hydro. The library works perfectly well with:
Data loaded by other means (
xarray.open_dataset,rasterio, etc.)Visualization using matplotlib, cartopy, or other tools
Your existing data pipeline
earthkit integration is recommended, not required.